Entity Relationship Modeling (ERD)
This lesson covers the basics of creating an entity relationship diagram and was created by Prof. Rhonda Richards.
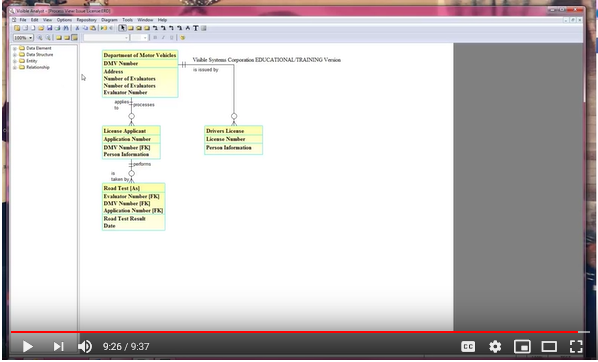
In Visible Analyst’s terminology, a diagram containing a picture of all or a subset of your data is called a view. Each view can show an arbitrarily large or small part of your data model. You can show multiple views of your data model by including different combinations of entities and relationships on various diagrams. However, the entire data model, including the data elements composing each entity, is retained in the repository and can be accessed by creating a global view of the data model. This feature is explained in Lesson 7.
For more details on this lesson, please see pages 93-106 of the Visible Analyst Tutorial.
Let us know if you found this video useful!
