INTRODUCTION
The Visible Analyst Zachman Edition provides a Model Driven approach for defining, designing, building, testing, documenting and supporting Enterprise Architecture (EA), information systems and software products. Model Driven Architecture (MDA) tools are based on logical dissection of the real world into understandable models, processes and components. MDA tools provide mechanisms for evaluating current information activities, defining proposed changes, producing and validating new information processes and focusing on changes that will enhance the performance and operation of the organization. The successful use of MDA tools requires an understanding of the underlying concepts and logic and a comfortable knowledge of the operation and use of the MDA tool.
Visible Analyst has been created to make the implementation of MDA techniques a logical, flexible, natural and easy-to-perform process. Visible Analyst is a seamless MDA tool that integrates all phases of planning, analysis, design, code generation, and reverse engineering. Visible Analyst provides facilities for the development of function, object/class, state transition, data, data flow (process), activity, Use Case, sequence, collaboration, and structure chart (product) models for an information system. With the introduction of the Business Process Modeling Notation (BPMN) the Visible Analyst provides a modeling notation that can be communicated to and understood by all business users, from the business analysts developing the models, to the technical analysts implementing the model processes, to the business people who manage and monitor the processes. An integrated repository containing all defined model elements, extensive additional component definitions and free-form notes and definition fields provides a continuous life-cycle library of the design and development process. The Visible Analyst repository is used for reports of project content and to generate various forms of schema and application software code.
These lessons have been designed to lead you through the Visible Analyst mechanics and to demonstrate how easy Visible Analyst is to use. These lessons cover the entire development process, from drawing functional diagrams to generating program code. You can follow the lessons in sequence or you can select just the ones of interest to you. Like Visible Analyst itself, you have the flexibility to use any piece of the tool in any order that is reasonable within the project.
The tutorial also provides you with some insight into MDA concepts and underlying logic. These concepts are basically simple and logical. They allow you to break the complex real world into smaller and more manageable chunks that can be defined quickly and then be used to build operational pieces that work in the complex real world. Each of the MDA models provides a different view of the real world. Visible Analyst ties these models together and provides a vehicle for using them to define and evaluate current information operations.
Proposed changes in the information processes, procedures and sequences are reflected into the MDA models and then are used to build a new set for the proposed change operations. The analysts, designers, developers and users interact with the Visible Analyst models and data repository to verify and validate the information steps and procedures for their organization and operations.
Once the architecture of the new information system is considered sound and solid, the software designer moves to defining and building the new product components and the software code. Visible Analyst supports the development of physical programming modules through the structure chart model. It also supports the definition and recording of pseudo code in the Visible Analyst repository. From these definitions and the data model, Visible Analyst generates database schema, SQL code and application shell code. Test plans, sequences, test cases and scenarios can also be generated in the repository notes fields.
One new feature of the Visible Analyst has been the additional support for the Business Process Modeling Notation based on the Business Process Modeling Initiative developed by the Object Management Group (omg.org). The complete specification can be downloaded from the OMG website, www.omg.org. The primary goal of BPMN is to provide a modeling notation that can be communicated to and understood by all business users, from the business analysts developing the models, to the technical analysts implementing the model processes, to the business people who manage and monitor the processes. The BPMN models describe the sequence of business processes with support for parallel and conditional behavior.
FAST TRACK USERS
Those who like to work on the Fast Track should read Lesson 5 - Diagramming Basics and follow the steps for creating a project, creating a diagram, and some optional settings that are available with Visible Analyst. Lesson 5 gives you the basic skills for working with Visible Analyst. We recommend that you work through the other lessons to discover the more advanced features that make Visible Analyst a powerful tool. Throughout the tutorial are references to features that are not demonstrated in the tutorial but that may be of interest to you. You can find more information about these features in the Operation Manual, which can be downloaded from our Web site using this link http://www.visible.com/Products/Analyst/manual.pdf. The online help feature in Visible Analyst, accessed from the Help menu or by pressing F1, also provides you with more information on the referenced subjects.
Note: Since Visible Analyst is available in multiple configurations, the software you purchased may not include all of the diagram types or advanced features described in these lessons. The basic drawing techniques apply to all diagram types, and you are encouraged to work through the brief exercise in Lesson 5 - Diagramming Basics. Thereafter, you can skip chapters that do not apply to your Visible Analyst package.
OVERVIEW OF MDA CONCEPTS
MDA concepts involve creating and defining different models or views of the real world and then using these models to analyze and develop changes and modifications to the information processes of the organization. Some of the models provide definitions of factual items such as business functions, objects and data entities; others show how things flow, connect or relate to one another. Some of the models evolve and expand to match reality and others are done as snapshots, showing as-is and then as-proposed operations. The views are composed graphically using symbolic objects, line connectors and some rules of logic and structure. The objects are given names called labels that populate the data repository with entries that can be retrieved, expanded, detailed and used to define and document the contents of the project.
There are logic rules for many parts of the models. The models can be tested and evaluated for completeness, consistency, rule compliance and other factors. All of the models and the repository are interrelated, and many share common components such as databases, objects and/or actions. The development of the models is iterative, often requiring several sessions before the models are complete and realistic. The ability to move from one model to another and to work on different ones at different times is critical to a successful MDA tool.
The rules of MDA deal with the checking of consistency and logical structures such as naming and complete linkages. Errors found in models are reported during the Visible Analyst analyze process. These errors should be corrected to maintain consistency and accuracy of the models. However, Visible Analyst, unlike software compilers, allows you to continue with any reasonable MDA operation without waiting until you have corrected all errors. This allows you to continue progress on the project and its components. However, it also leaves you responsible for returning and correcting your errors.
The Basic MDA Models include:
Functional Decomposition Model (also known as a Business Model) - Shows the business functions and the processes they support drawn in a hierarchical structure.
Entity Relationship Model (also known as a Data Model) - Shows the data entities of the application and the relationships between the entities. The entities are things and the relationships are actions. The data attributes can be defined for the entities via the repository and then shown on the diagram. Entities and relationships can be selected in subsets to produce views of the data model.
Object Model (also known as an Object Class Model) - Shows classes of objects, subclasses, aggregations and inheritance. Defines structures and packaging of data for an application.
State Transition Model (also known as the Real Time Model) - Shows how objects transition to and from various states or conditions and the events or triggers that cause them to change between the different states.
Process Model (also known as the Data Flow Diagram) - Shows how things occur in the organization via a sequence of processes, actions, stores, inputs and outputs. Processes are decomposed into more detail, producing a layered hierarchical structure.
Product Model (also known as a Structure Chart) - Shows a hierarchical, top-down design map of how the application will be programmed, built, integrated and tested.
Use Case Model – Shows the relationship between a user and a computer system.
Activity Model – Is a special form of state diagram where states represent the performance of actions or sub-activities. Transitions are triggered by the completion of the actions or sub- activities.
Sequence Model – Shows how objects collaborate in some behavior.
Collaboration Model – Shows an interaction organized around the objects in the interaction and their links to each other.
Business Process Modeling Notation- Provides a modeling notation that can be communicated to and understood by all business users, from the business analysts developing the models, to the technical analysts implementing the model processes, to the business people who manage and monitor the processes.
Repository or Library Model (also known as the Project Database) - Keeps the records of all recorded objects and relationships from the diagrams and allows for the definition of detailed specifics and extensions of the individual items. Used for evaluation, reporting and generation of details about the project and its products.
Visible Analyst Choices
Today systems designers have multiple choices. They can follow the Structured Analysis and Structured Design (SA/SD) approach and build on functions/processes, data models and product concepts; or they can follow the object-oriented approach and build class hierarchies, dynamic states and functional/process models. Both approaches can build better information systems and both cover similar aspects of information systems definition. However, both use different sequences of effort and focus on different aspects of the project. Visible Analyst allows you to choose either approach or to combine the approaches to develop a comprehensive product definition, design and development mechanism.
There are five keys to using Visible Analyst, or any MDA tool. The first key is to develop the discipline to apply and follow the steps and procedures of the technique. The second key is to develop skills in conceptualizing the MDA models to represent the real world requirements. The third key is to be consistent in how you define and describe the real world. The fourth key is to strive to be complete in the definition of all of the major parts of a real world application. The fifth key is to progress from the conceptual to the operational specifications and construction of a working information systems process.
VISIBLE ANALYST OVERVIEW
Visible Analyst is a Microsoftâ Windowsâ application. Versions 7.1 and higher of Visible Analyst work with Windows NT, 2000, 2003 Server and XP while VA2008 is also VISTA compatible. This section defines the overall structure of Visible Analyst and identifies some of its key operational characteristics.
Visible Analyst Architecture
The basic components of Visible Analyst are: a set of diagramming tools, a rules module, and a repository module. Diagramming tools are used to construct the ―blueprints‖ of your target system. These lessons guide you in the creation of diagrams and provide you with basic information on the uses of the diagrams.
A system is designed and constructed according to rules, and the rules module manages the methodologies of Visible Analyst tools for you. Visible Analyst allows you to choose the rule set you prefer to use as a guideline for the development of your system. These rules are important in determining the appearance of your diagrams, as well as the entire structure of your system. For the purposes of the tutorial, you are introduced to the supported techniques and learn how to designate the rule set to use and the different symbol types used for each rules methodology.
Figure 1-1 Visible Analyst Workspace
The repository module controls the individual repositories of each of your projects. A project‘s repository stores detailed information about objects that are used in developing a system. An object in the repository includes processes, entities, relationship lines, classes, etc. The type of information contained in the repository for each object includes description, composition, values and meanings, location references, and other very specific detail information (see Lesson 17 – Working with The Repository Functions for details). The repository makes Visible Analyst a very powerful systems development tool. Visible Analyst is much more than just a diagramming tool; its repository and rules sets provide definition, documentation, and consistency capabilities for the entire system. Visible Analyst has advanced features enabling you to generate reports and code for your target system, using the information contained in a project repository.
Windows Version Features
This section highlights some of the Windows-specific features of Visible Analyst.
The Application Workspace
All work in Visible Analyst is done either in the main application workspace, shown in Figure 1-1, or in the repository, described in Lesson 16 - Repository Functions.
Windows Configuration
Visible Analyst configuration features controlled through Windows include the hardware configurations, desktop colors, available printer drivers, and available fonts. Changes or additions to these features can be made through Windows and are reflected in Visible Analyst.
Multiple Document Interface
The Windows Multiple Document Interface (MDI) allows multiple diagrams to be open at one time. Open diagrams can be of the same or different diagram types (data flow diagrams, entity relationship diagrams, etc.). Diagrams may be maximized, taking up the entire workspace, sized so that several diagram windows are visible, or minimized to icons appearing at the bottom of the application workspace. Any window larger than an icon is editable. You can cut, copy, and paste to and from the Windows Clipboard to move objects between diagrams and even between other Clipboard-aware applications. (See Figure 1-2.)
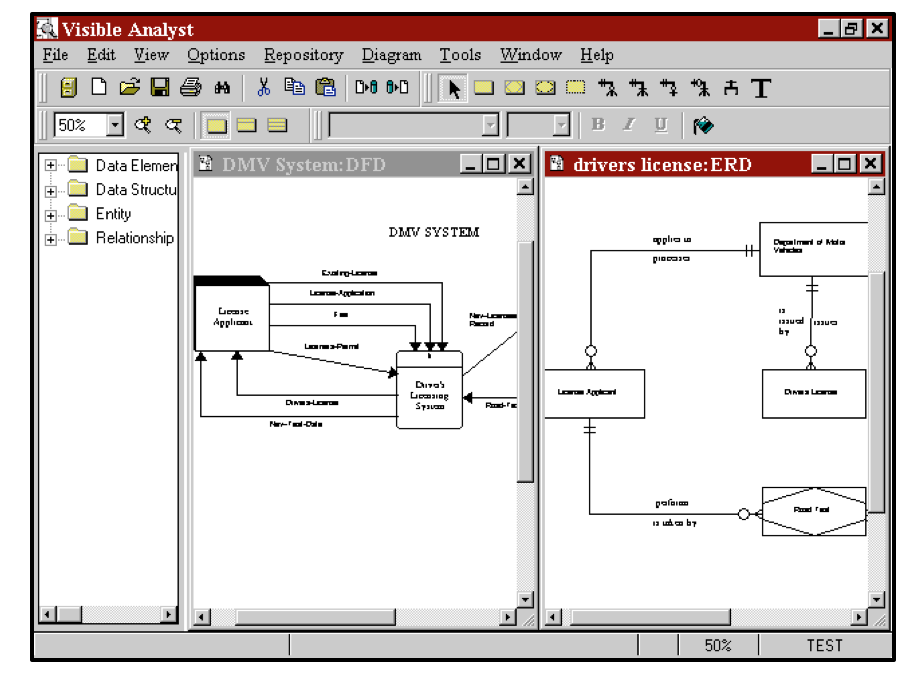 Figure 1-2 Visible Analyst Multiple Document Interface
Note: 2 Users not familiar with MDI Windows programs should take note: there is a difference between the diagram Control menu button and the Visible Analyst Control menu button. The former is in the top left corner of the diagram window, or to the left of the File menu if the diagram is maximized. This Control menu contains functions that affect the diagram only, such Maximize, Close, etc. The latter is in the top left corner of the Visible Analyst window. The Visible Analyst Control menu affects the whole Visible Analyst window and program.
Selecting a Diagram Object
A diagram object is anything that appears on a diagram: symbol, line, text, or block. When you click on an object with a mouse button, it becomes the current or selected object and you can perform various operations on it. There are five different ways to select an object. The following paragraphs describe the effect of selecting an object with the left mouse button, the right mouse button, a double-click with the left mouse button, the TAB key and selecting a Block.
Left Mouse Button
Clicking on an object with the left mouse button selects it. The object changes color to show that it has been selected allowing you to make changes to the object or to move the object. When a symbol or line is selected, text labels for that object are automatically highlighted.
Right Mouse Button
Clicking on an object with the right mouse button also selects it. In addition, the Object menu appears containing all of the functions that can be performed on that object.
Notes:
2 Unless stated to the contrary, instructions to click a mouse button refer to the left button. Instructions for the right button are explicitly mentioned.
2 Left-handed mouse users: if you use a mouse with the buttons reversed, you should reverse references to left and right mouse buttons in this text.
Double-Click: If you double-click on an object with the left mouse button, the repository entry for that object appears. If the object is unlabeled, a dialog box for labeling the object is displayed. Double- clicking is also used to indicate the end of a line.
TAB Key: To highlight only the text label for a selected symbol or line, press the TAB key until the appropriate item is highlighted. (If the label is located outside the symbol, you can click on it directly.) Continuing to press the TAB key sequentially selects each object on the diagram.
Selecting a Block: To select a block, meaning a group of objects, on a diagram, click and hold the left mouse button and drag the mouse to draw a box around the objects. All objects completely contained within thatbox change colors to show that they are selected. Once a block is selected, you can perform various functions on the block such as cut, paste, move, change text settings for contained objects, and other actions.
Deselecting Objects: To deselect any object or block, simply click the left mouse button on an empty area anywhere on the diagram workspace outside of the object or block. The items that had been selected return to their usual color. You can also use the Clear function on the Edit menu.
Shortcut Keys
Shortcut keys provide fast access to functions without using the menus. Some of the active shortcut keys used in Visible Analyst are standard Windows shortcut control key sequences, such as CTRL+P, which is the command for Print; others are specific to Visible Analyst. All available shortcut keys are listed here.
|
CTRL+A |
Analyze |
Analyzes a diagram or entire project. |
|
CTRL+C |
Copy |
Copies to clipboard. |
|
CTRL+D |
Define |
Accesses the repository. |
|
CTRL+E |
Connect |
Draws linesbetween selected symbols. |
|
CTRL+F |
Find |
Accesses the search mode. |
|
CTRL+L |
Lines |
Sets the cursor to line drawing mode. |
|
CTRL+N |
New Diagram |
Creates a new diagram. |
|
CTRL+O |
Open Diagram |
Opens an existing diagram. |
|
CTRL+P |
|
Prints the current diagram or queue contents. |
|
CTRL+Q |
Report Query |
Generates a custom repository report. |
|
CTRL+R |
Reports |
Generates a standard repository report. |
|
CTRL+S |
Save |
Saves the current diagram. |
|
CTRL+T |
Text |
Sets the cursor to text adding mode. |
|
CTRL+U |
Clear |
Deselects diagram object or block. |
|
CTRL+V |
Paste |
Pastes from Clipboard. |
|
CTRL+T |
Snap Symbols |
Aligns selected symbols in a row. |
|
CTRL+X |
Cut |
Cuts to Clipboard. |
|
CTRL+Z |
Undo |
Erases partially drawn or undoesmoved line. |
|
DEL |
Delete |
Deletes object from diagram. |
|
F1 |
Help |
Displays context-sensitive help. |
|
ALT+R |
Delete Project |
Deletes a project with no project files. |
|
SHIFT+F1 |
Menu Help |
Enters Help mode for menu items. |
|
SHIFT+F10 |
Object Menu |
Displays repository object menu. |
Another standard Windows shortcut method for accessing a menu item without using the mouse is to press the ALT key followed by the underlined letter of the menu title or menu item that you would like to access. For example, to access the File menu, press the ALT key followed by the F key. It is not necessary to hold down the ALT key while pressing the F key.
Control Bar
The control bar, shown in Figure 1- 3, is located above the diagram workspace and gives you quick access to commonly used functions and types of objects that can be added to a diagram. The control bar can contain up to four tool bars.
- The standard tool bar contains basic buttons, such as Select Project, Open Diagram, etc., common to most Windows applications.
- l The diagram tools tool bar contains the symbol, line, and text buttons appropriate for the current diagram.
- l The view tool bar contains controls that change the zoom level and entity/class view level.
- l The font tool bar contains controls that allow changing the current font characteristics, such as font type, font size, etc.
You can customize the control bar by selecting Control Bar from the Options menu to display the Customize Control Bar dialog box. Using this dialog box, you can select the tool bars to be displayed and select control bar options such as Show Tooltips, Large Buttons, Flat Buttons, and Hot Buttons. You can also right-click the control bar itself to display a properties menu that allows you to toggle the individual tool bars on or off or to select the Customize option. To change the size and position of the tool bars, click the left mouse button on the ―gripper‖ (the two vertical bars at the beginning of each tool bar) and drag the tool bar to the desired position. From the Customize Control Bar dialog box, you can also undock the diagram tools tool bar so that it appears in its own floating window.
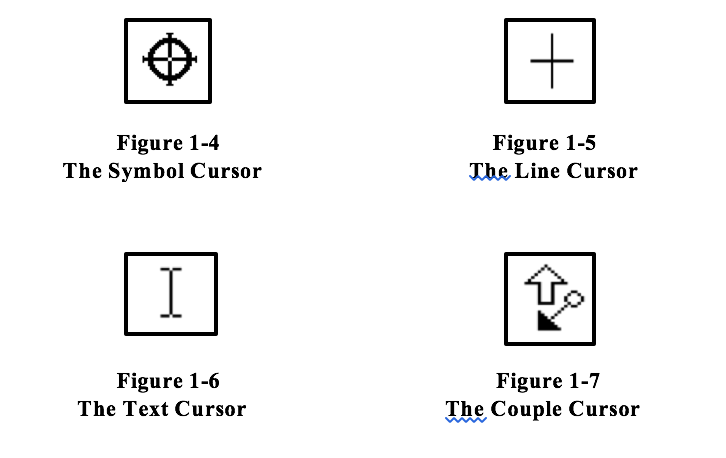
The ë button (shown in Figure 1-3) is used to change into selection mode (also called editing mode). In selection mode, objects can be selected on the diagram to be changed or moved, or a box can be drawn around many objects on a diagram, for moving, cutting and pasting, or changing text settings for groups of objects. Click one of the drawing mode buttons, and you can add that type of item to the diagram. The object types include symbols, lines, couples, and caption text. When you choose one of the drawing mode items from the control bar to add to your diagram, the cursor automatically changes to indicate that you are either in symbol, line or couple adding mode, or caption text adding mode. Specifically, this means that while the cursor is positioned inside the diagram workspace and it is something other than an arrow, which indicates selection mode, clicking on the mouse adds an object to the diagram.
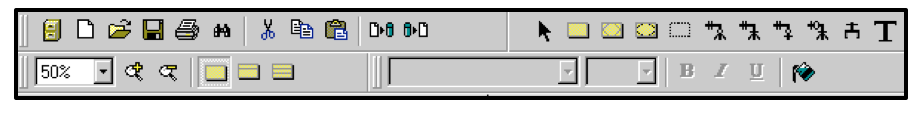
Figure 1-3 The Control Bar for Entity Relationship Diagrams with All Tool Bars Displayed
For example, when the diagram tools tool bar is displayed on the control bar, you can easily select the particular symbol you want to add to the diagram. A symbol is added to your diagram centered at the cursor location anytime you click on the diagram workspace while the cursor indicates symbol drawing mode.
Help Bar
As you move through the Visible Analyst menus, a line of text appears on the help bar at the bottom of the application workspace that briefly explains what that menu item does. The current zoom level, current project and current object are also displayed. You can toggle this feature off and on from the Options menu.
Object Browser
From the Options menu, you can choose to have the Visible Analyst object browser displayed on your screen. The object browser displays a list of all the objects in the repository in a resizable window. When there are no diagrams open, or the current window is the diagram list, all objects are displayed. When a diagram is open, only those objects that are valid for that diagram type are displayed. If an object appears on the open diagram, it is displayed in bold. Double-click on a folder in the list to expand or collapse it; double-click on an object in the list to display the Define dialog box. You can also click on an object in the list and drag it onto your diagram. To resize the object browser, click on the right margin of the browser and drag to the desired size.
Menus
The menus are arranged in nine groups for browsing and selecting the various features of Visible Analyst. (Refer to Figure 1-1.)
File Menu
The File menu contains the functions for accessing and creating projects and diagrams. This includes all of the functions that cause the opening of another diagram, such as Nest, Spawn, and Page. (These functions are explained under the specific diagram type where each is used.) It also includes a list of Recent Diagrams and Recent Projects. The Save, Print, and Exit functions are also found in the File menu. If you are using a network version, information about network activity and modifying the user list is contained in the File menu. If you purchased a copy of the Zachman Framework Edition, the framework can be opened and closed using the Zachman Framework option.
Edit Menu
The Edit menu contains the standard Windows editing functions including Cut, Copy, Paste, Find and Delete. There is also an Undo function for removing partially drawn lines and undoing a move line operation. The Strategic Planning options allow you to add a New Statement, Promote, Demote, Move Up, or Move Down, a strategic planning statement.
View Menu
The functions contained in the View menu allow you to change the appearance of the active diagram. There are functions to change the zoom level and to give you the ability to change the items displayed on a diagram, including Show Line Names, Show Symbol Names, Show Discriminators, Show Statement Types, Show Priority, Show Description, Class and Entity Display Options, Physical Schema, Events, and Messages. Also on the View menu are Grid and Ruler, functions that make it easier to position objects accurately on a diagram.
Options Menu
The Options menu contains functions that allow you to change default settings for Visible Analyst. For diagram drawing and manipulation settings, the functions include automatic labeling of symbols and lines, Line Settings defaults, Text Settings defaults and diagram Colors, as well as on/off settings for Security, the Help Bar, the Object Browser, and the Control Bar. The Options menu also includes settings for interaction diagrams, model balancing rules, SQL schema and shell code generation, DDS name translation, user-defined attribute and object definition, planning statement types, Zachman Framework cell settings and symbol template settings.
Repository Menu
All of the selections included in the Repository menu are functions performed on the information contained in a project‘s repository. These include Define, which allows repository access, schema and shell code generation, schema / model comparison, Key Analysis and Key Synchronization, Model Balancing, and repository Reports. The Divisions function is used with the Enterprise Copy feature and is explained in the on-line Help. The Divisions and Enterprise Copy feature are not available in the Visible Analyst Student edition.
Diagram Menu
The Diagram menu contains functions for selecting, manipulating, and analyzing diagram objects. These include functions for selecting Symbols, Lines, or Text to add to a diagram, as well as functions for changing or stylizing a selected item on a diagram. The function for analyzing the diagrams according to the selected rules methodology, modifying the diagram settings and the function for modifying an existing view are also contained in the Diagram menu.
Tools Menu
The Tools menu contains the various functions that can be performed on a project. These include Backup, Restore, Copy Project, Delete Project, Rename/Move, Import, Export, and copying information between projects. The utility for assigning user access to the multi- user version of Visible Analyst is also found in the Tools menu. The Enterprise Copy and Enterprise Tag Maintenance features are not available in the Visible Analyst Student Edition but are explained in the on-line Help.
Window Menu
The Window menu allows you to change the arrangement of the open diagrams. Diagrams can be automatically arranged in a Tile, Cascade, or minimized (icon) format. You can also switch between open and minimized diagrams.
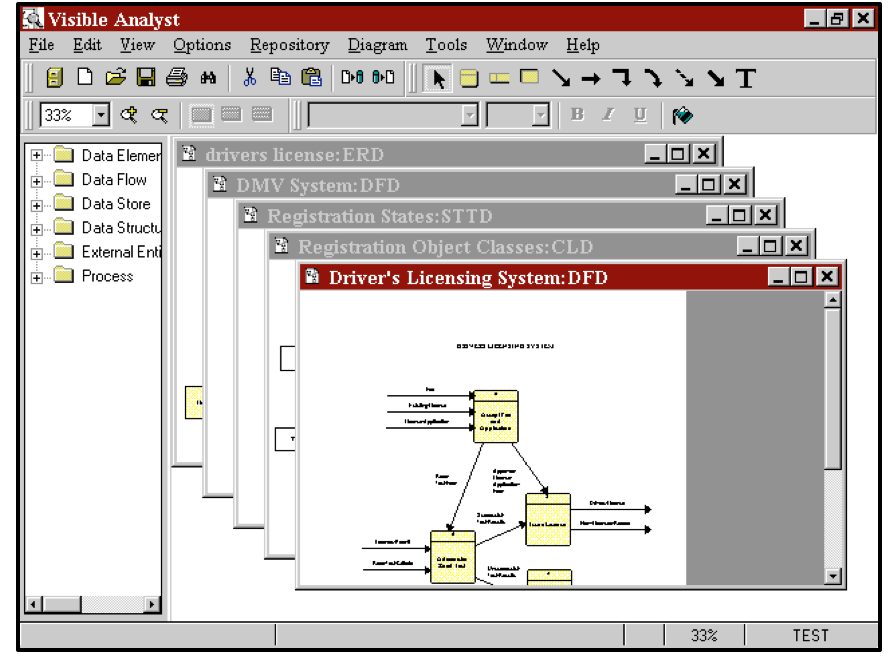
Figure 1-8 Cascaded Multiple Diagram Windows
Help Menu
The Help menu allows you to access the Help features, product and user information, and Visible Analyst on the Internet

